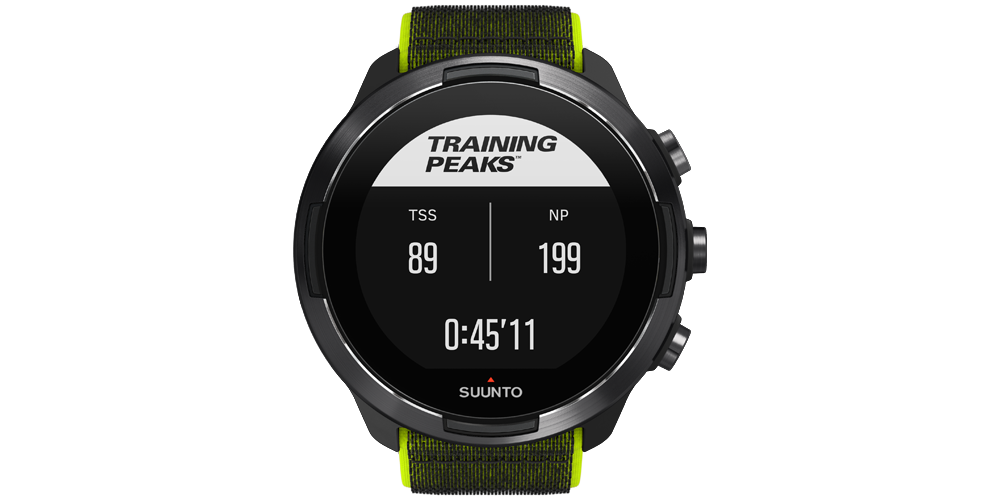
Together with TrainingPeaks we give you the tools and data to take command of your training. You track your workouts with your Suunto watch and TrainingPeaks gives you in-depth analysis and planning tools to achieve your full potential. After each activity, you can analyze your performance to determine where you are at. (Read more about benefits you get with Suunto & TrainingPeaks.)

On Suunto 9 and Suunto 5 watches you are also able to follow selected TrainingPeaks metrics in real-time. This lets you adjust the effort and duration of the exercise on the go, helping you reach your goal. TSS, IF and NP can be accessed in the SuuntoPlus section of Suunto 9 and Suunto 5 watches.
Read on to learn more about these metrics!
Normalized Power (NP)
In essence, Normalized Power is an estimate of the power that you could have maintained for the same physiological “cost” if your power output had been perfectly constant (e.g., as on a stationary cycle ergometer), rather than variable. Keeping track of normalized power is therefore a more accurate way of quantifying the actual intensity of training sessions, or even races.
For example, it is common for average power to be lower during criteriums than during equally-difficult road races, simply because of the time spent soft-pedaling or coasting through sharp turns during a criterium. Assuming that they are about the same duration, however, the normalized power for both types of events will generally be very similar, reflecting their equivalent intensity. In fact, normalized power during a hard ~1 hour long criterium or road race will often be similar to what a rider can average when pedaling continuously during flat 40k time trial – the normalized power from mass start races can therefore often be used to provide an initial estimate of a rider’s threshold power.
Intensity Factor (IF)
Although normalized power is a better measure of training intensity than average power, it does not take into account differences in fitness within or between individuals. TrainingPeaks therefore also calculates an Intensity Factor (IF) for every workout or time range analyzed. IF is simply the ratio of the normalized power as described above to your threshold power.
For example, if your normalized power for a long training ride done early in the year is 210 W and your threshold power at the time is 280 W, then the IF for that workout would be 0.75. However, if you did that same exact ride later in the year after your threshold power had risen to 300 W, then the IF would be lower, i.e., 0.70. IF therefore provides a valid and convenient way of comparing the relative intensity of a training session or race either within or between riders, taking into account changes or differences in threshold power.
In Suunto watches we use the treshold as limit between Zone 4 and Zone 5. This means that the effort you have been riding is a share from an-aerobic threshold level. Intensity factor gives you a simple info on how hard you are working out.
The intensity factor for recovery workouts should be under 0.75, for endurance rides 0.75-0.85, for tempo workouts 0.85-0.95 and for an-aerobic threshold intervals 0.95-1.05. The short timetrials I.e. 10km the intensity factor should be 1.05-1.15.
To get similar values with Suunto watch that you get from TrainingPeaks, make sure your Zone 4 | Zone 5 limit is same as functional threshold power in TrainingPeaks. You can find the zone setup on your watch settings: Training » Intensity zones » Advanced zones.
Training Stress Score (TSS)
Exercise intensity is clearly an important factor in determining the type and magnitude of physiological adaptations to training. Together, exercise frequency and duration determine the overall training volume are important factors as well. However, there is obviously an interaction between training intensity and volume. At some point as intensity goes up volume must come down, and vice-versa, or else you will become overtrained.
To quantify the overall training load and hopefully help avoid such a situation, TrainingPeaks uses your power data to calculate a Training Stress Score (TSS) for every workout, and provides a graphical summary of your recent TSS on your Athlete Home page.
Read more about Normalized Power, Intensity Factor and Training Stress Score at TrainingPeaks.com
READ MORE
Training with TSS and hrTSS
3 TrainingPeaks training metrics to adjust your running on the go
Lead image: Kevin Scott Batchelor